
Energy Circle writes a lot of content for home performance, HVAC, and solar contractors—at least 600 to 800 blogs every year, by conservative estimates (and that’s not counting all the other types of content we create, from new website pages to emails, infographics, videographics, and more). That means we have access to content-related data for dozens of companies, some of which go back nearly a decade.
With all this information at our fingertips, we wanted to take an in-depth look at some of our clients’ best-performing blog posts and see what we could learn. Is there a magic formula to writing a killer blog? (Spoiler alert: No, there isn’t, but we still found plenty of useful takeaways that can point you in the right direction!)
Why You Should Be Writing Contractor Blog Posts
Blog posts are one of the best ways to drive visitors to your home services contracting business’ website. Writing high-quality blogs on topics and services that homeowners are interested in increases your website’s organic ranking (how likely Google or other search engines are to feature your website prominently on search result pages). This, in turn, can favorably affect your website’s local search rankings (including your Google My Business/Google Business Profile) and can even lower the cost of Google Ad campaigns.
Content marketing remains a reliable and essential method for contractor lead generation—this recent blog post explains why.
What Data Will We Be Focusing On?
If you’re data geeks like us, you know there are many metrics you can measure when it comes to tracking how well your blogs and other online content are performing. We used Google Analytics and SEMRush to gather all of the data we’re presenting today. Here are the specific key performance indicators (or KPIs) we’ll be looking at:
Publish date—By seeing month-to-month changes in page views, we can identify possible long-term patterns for how successful blogs perform over time (this is visualized with a Lifetime weekly performance graph we’ve included for each blog example).
Total page views & percentage of total site page views—We’ll look at both total page views as well as what percentage of overall traffic to the contractor’s website a single blog accounted for between the time it was published and the present day. Total page views was the primary metric we used to select the eight blogs we ended up using for our case study.
Average time on page—This is the average length of time that a user spent on that blog page—higher numbers suggest that the user found the information useful. For comparison, a two or three minute average time on-page would be considered good for our clients.
Bounce rate—Bounce rate refers to the percentage of visitors who visit a blog post and leave without viewing any other pages on the site. In particular, we’ll be looking to see if a high bounce rate could negatively affect your search engine rankings.
Backlinks—Backlinks are when other websites link to your site. Does high traffic to a blog post necessarily mean that lots of people are linking to it or sharing it?
Flesch Reading Ease Score & Flesch–Kincaid Grade Level—We calculated how each of our eight blogs scored on common readability tests to see if there is any connection between the popularity of a blog and the reading level it’s written for.
Starting with Total Page Views and Percentage of Total Page Views (what we were really after is blogs that punched way above their weight class), we selected eight blogs published on the websites of eight different Energy Circle clients: home performance, HVAC, and solar contractors both big and small operating across the country.
Most of these blogs were written by our own content marketing team, but a few of them are old enough that they were written before we started working with the client on their digital marketing. ALL of the blogs selected have done exceedingly well since being published, so we were eager to dive in and see what we could find.
Digging into the Data: 8 Blogs
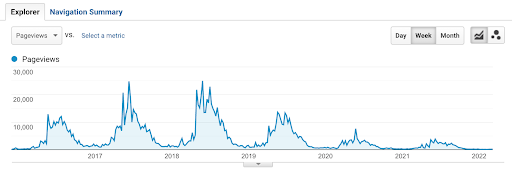
1. Blog Title: “What Is Dirty Sock Syndrome & How Do I Fix It?”
Published: June 2019 
Total Page Views: 30,791
% of Total Page Views for Overall Site: 9.85%
Average Time on Page: 7:45
Bounce Rate: 90.51%
Backlinks: 32
Flesch Reading Ease Score: 65.6
Reading Level: 8th & 9th grade
Lifetime weekly performance graph:
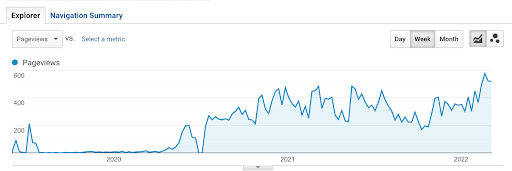
2. Blog Title: “How Is Insulation Installed in Existing Walls?”
Published: July 2020 
Total Page Views: 21,559
% of Total Page Views for Overall Site: 31.20%
Average Time on Page: 6:55
Bounce Rate: 81.55%
Backlinks: 14
Flesch Reading Ease Score: 54.5
Reading Level: 10th to 12th grade
Lifetime weekly performance graph:

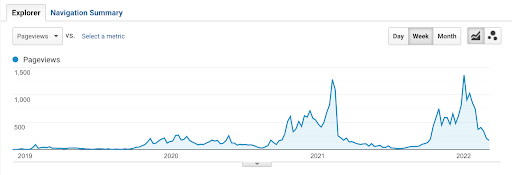
3. Blog Title: “Should I Leave the Furnace Fan On All Winter?”
Published: December 2018 
Total Page Views: 34,852
% of Total Page Views for Overall Site: 17.85%
Average Time on Page: 7:03
Bounce Rate: 95.51%
Backlinks: 11
Flesch Reading Ease Score: 74.2
Reading Level: 7th grade
Lifetime weekly performance graph:
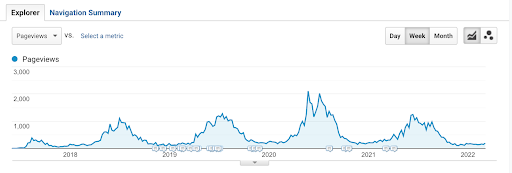
4. Blog Title: “Replacing an AC Fan Motor — How Much Will It Cost?”
Published: June 2017 
Total Page Views: 114,983
% of Total Page Views for Overall Site: 23.69%
Average Time on Page: 6:28
Bounce Rate: 83.27%
Backlinks: 87
Flesch Reading Ease Score: 54.3
Reading Level: 10th to 12th grade
Lifetime weekly performance graph:
5. Blog Title: “Outside AC Unit Won't Turn On? What to Do Before Calling for Repairs”
Published: December 2015 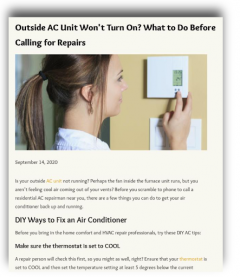
Total Page Views: 1,305,422
% of Total Page Views for Overall Site: 20.78%
Average Time on Page: 8:02
Bounce Rate: 91.31%
Backlinks: 40
Flesch Reading Ease Score: 74.8
Reading Level: 7th grade
Lifetime weekly performance graph:
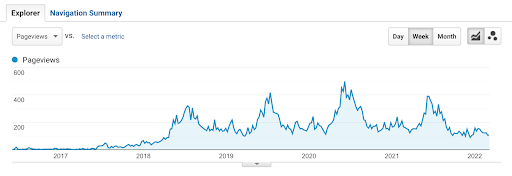
6. Blog Title: “This Is Why You Should Seal Your Crawl Space”
Published: March 2018 
Total Page Views: 19,986
% of Total Page Views for Overall Site: 10.63%
Average Time on Page: 3:45
Bounce Rate: 90.19%
Backlinks: 15
Flesch Reading Ease Score: 67.2
Reading Level: 8th & 9th grade
Lifetime weekly performance graph:
7. Blog Title: “Adding a Second Return Is Almost Always a Good Idea”
Published: June 2016 
Total Page Views: 42,521
% of Total Page Views for Overall Site: 15.86%
Average Time on Page: 5:56
Bounce Rate: 93.10%
Backlinks: 20
Flesch Reading Ease Score: 68.1
Reading Level: 8th & 9th grade
Lifetime weekly performance graph:
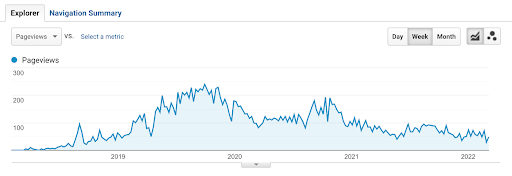
8. Blog Title: “What Happens When You Sell or Buy a Home with Solar Panels”
Published: June 2019 
Total Page Views: 27,808
% of Total Page Views for Overall Site: 3.67%
Average Time on Page: 8:32
Bounce Rate: 70.28%
Backlinks: 30
Flesch Reading Ease Score: 61.4
Reading Level: 8th & 9th grade
Lifetime weekly performance graph:

Unpacking the Data: 7 Takeaways & Insights To Help Improve Your Content Marketing
1. Blogs can take a long time to catch fire
If you’re ready to declare your latest blog post a failure after the first week, the lifetime weekly performance graphs for each blog we studied may surprise you: In all but one case, it took at least a year for the blog to reach its weekly traffic peak—in one case, nearly four years!
2. This type of “viral” content doesn’t depend on shares
It’s easy in the internet age to think of successful online content as something being shared between users or reposted. But when it comes to contractor blogs, that isn’t the case. Most of these blogs didn’t have great backlinks (either in quantity or quality), but they still racked up tens of thousands of views anyways because of how frequently they showed up in search results.
3. Average time on page trumps high bounce rates
The average time on page for these eight blog posts is in the 6:30-8:00 range, impressive given that the average page for one of our clients is closer to two-three minutes.
But the majority of these blogs had bounce rates over 90%, which indicates that almost everyone reading one of these high-performing blogs left the website as soon as they were done.
How do these metrics affect what Google thinks of your website/company? On one hand, they’ve stated that Google Analytics data (which both of these metrics are) is not a ranking factor. On the other, there are less direct ways that search engines could gather similar data, even if you haven’t added Google Analytics tracking on your site. Given how well each blog is performing, we can assume that high bounce rates alone are not enough to prevent you from ranking well, especially if your average time on page rates are high.
4. Reading level grade: D
Research has found no correlation between “reading level scores” and organic ranking, and Google has previously said that their algorithms don’t factor it in. Anecdotally, we found these kinds of readability tests to be fairly unsophisticated as well. Our suggestion: take these scores with a grain of salt and don’t weigh them heavily—search engines don’t seem to.
4. A rising blog lifts all boats
Is having one or two blogs that dramatically outperform all other pages on your website a bad thing?
Publishing a blog that shows up in the search results across the country isn’t going to be very helpful when 99% of users are likely not in your service area. Even if a visitor finds your website helpful, they couldn’t schedule services with your company even if they wanted to.
But the more your website can showcase expertise, authority, and trustworthiness (EAT) to Google, the more visible you’re likely to become in local search and to customers who are in your service area. A blog that catches fire can pull the rest of your website up with it—but keep in mind that even though you have tens of thousands of new site visitors, far fewer will turn into leads.
5. Do titles matter?
Six of the eight blog titles in our case study were written in the form of questions that homeowners might potentially ask—and we don’t think that’s a coincidence. Given that Google and other search engines are often trying to provide users with helpful answers, it’s worth spending time crafting a title (not to mention the blog post itself) with the homeowner in mind.
6. Don’t be afraid to get specific
Almost every blog post we studied deals with specific aspects of general contractor services. With so many blogs already written and lots of competition from other contractors offering similar services, don’t ignore narrower topics to chase after the same broad keywords that everyone else is.
For example, fewer homeowners will Google how much an AC fan motor costs than will search for AC repair, but as one of our clients discovered, fewer contractors are going to write an entire blog on AC fan motor costs, improving your odds of getting that click.
7. The number of “at-bats” is more important than your home run percentage
This sports metaphor is a bit convoluted, but: don’t focus on trying to hit a home run every time you’re up to bat. Just keep stepping up to the plate and swinging—write enough quality blog posts consistently (and at least somewhat strategically), and you’ll knock one out of the park eventually.
Where Do Winning Blog Topic Ideas Come From?
Keyword research (looking into the data on popular search engine queries) is a common and reliable way to identify potential blog topics. But it has its limitations: data is inherently old news, and you can only find out what people have searched for already, not what they’ll be looking for tomorrow. Here are three approaches any contractor can use to brainstorm blockbuster blog posts:
-
What questions are your customers asking you? They’re likely not the only ones asking, but local homeowners who don’t already know your business will be turning to Google, not you!
-
What’s on the news—how could current events change your customers’ mindset? It’s no surprise that the blog about buying and selling a home with solar panels took off at the same time that the housing market did. Plus, keeping an eye on the weather report for seasonal changes can offer relevant inspiration.
-
What do you think will be of future interest to homeowners? There are advantages to being first out of the gate—don’t be afraid to roll the dice on a prediction or a hunch every now and again!