
The lumpiness of customer demand in the HVAC and Home Performance business is quite possibly our industry’s biggest challenge. Staffing up for the peaks is not good business. Nor is paying crews when there’s no work in the off season. Yet the seasonality of demand is a fact of life. There are no easy fixes for seasonality, but it can be influenced by understanding the causes of demand spikes.
Temperature isn’t the whole story of the seasonality challenge, but it’s a big part of it. Even if you have a solid marketing strategy and mix, you are likely to still see fluctuations from day-to-day, week-to-week or month-to-month, and very often that has something to do with the weather. There’s no way to make things completely equal week-to-week or month-to-month. When people are comfortable, they are less likely to call for heating, cooling or home performance work - it’s when they are uncomfortable that they feel the need to take action.
The Data Analysis
Looking at three different companies in various geographies, a list of average weekly temperatures was compiled for all of 2017. For the same time period, weekly Google Analytics session data was compiled.
However, that data alone does not tell the whole story. To get a better picture of how weather affects business, the data is broken down into the following for each company:
-
Highest Weekly Average Temperature
-
Lowest Weekly Average Temperature
-
Middle Temperature
-
Absolute Difference
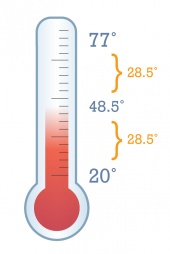
For example, in Company A, which you will see below, the highest average temperature was 77 and the lowest average temperature was 20, making the difference 57. That is then split in half to get 28.5. 28.5 was subtracted from 77 to get a middle temperature (48.5). By adding 28.5 to 20, the same number is achieved — the middle temperature.
From here, it’s important to determine how a variance from this middle temperature affects the number of users to the site. To do this, the absolute value of the average weekly temperature less the middle temperature is calculated, and then lined that up with the average users. This is data that can show correlation between temperature swings and site users more clearly than just looking at temperature.
The Results
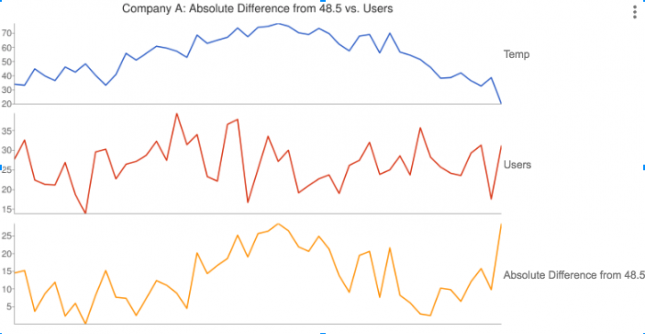
In most cases, you can correctly assume that when the temperature spikes to very hot or very cold, the traffic to an HVAC or Home Performance industry website will likely increase. In this chart, and the charts that follow, we look at Temperature, Users and the Absolute Difference from the Middle Temperature for the given company. Looking at just the Temperature and Users lines can show that they have some of the same periods where users and temperatures spike, but this isn’t always clear. That’s where the absolute difference line helps illustrate that when the temperature varies strongly from a middle temperature point, traffic to the site generally increases significantly.
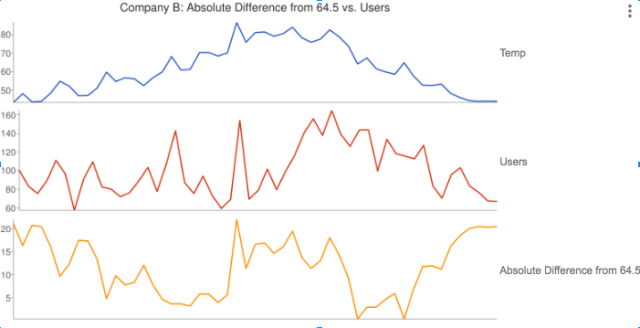
Like Company A, Company B shows similar spikes in Users and Absolute Difference.
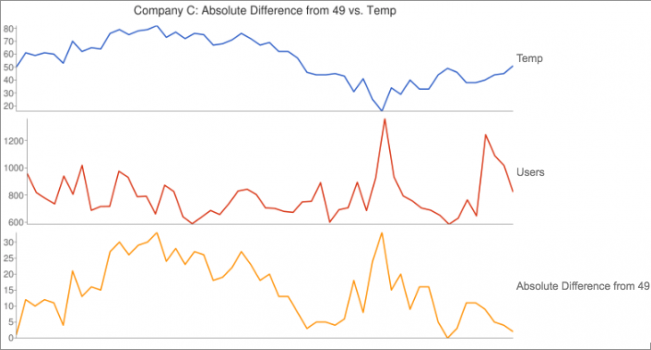
And not surprisingly, Company C also shows similar spikes in users as the absolute difference spikes. At about three-quarters of the way into 2017, there was a significant temperature drop in this geographic area. You can see that the absolute difference was at its high point — and the number of users shot up at that exact time.
What has been laid out shows how the number of users is correlated to temperature spikes and extreme changes. However, you can look at it the other way; if there are spikes in the data (more calls, more leads, busier), you could be in a conditioned room with no windows and take an educated guess that there is some weather event occurring that is outside of your control.
What This Means for You
Whether you are an HVAC or Home Performance contractor, it is inescapable that the weather has a massive influence on our day-to-day business. Here are a few things to consider when thinking about your marketing and the impact of weather:
-
Significant weather events (typically swings in temperature) WILL cause the phone to ring
-
A successful marketing program’s key goal should be to even out those spikes in demand; in other words, to get the market to act before temperature forces them to act
-
To a degree (haha), forecasted weather can be used in planning. If a heatwave is predicted in the 10 day forecast, yell at the top of your lungs for your customers to get their AC tuneup now!
-
There are seasonal triggers that cause the market to activate regardless of temperature. The weeks immediately following Labor Day are the best example of this.
We can’t plan for mother nature, but we can try our best to answer the calls during the times that people are the most uncomfortable.
A lot of clients ask if we should turn off advertising during busy times. The answer is no. Why would you want to reduce the possibility of getting a new customer not only in their time of need, but also down the road for future projects? While it may mean a few weeks of being overly busy, it may also mean a new customer for life.