
When we look at a digital marketing account’s performance, we generate monthly reports that tend to be around 20 pages and look at some 50+ metrics (many more when adding in varying date and channel dimensions).
But what can you do to get a quick glance at your website and digital marketing performance if you aren’t a Energy Circle client? Two words: Channel Report. (Well, Google Analytics Channel Report, so more like four words...)
Get started by logging into your Google Analytics account. Don’t have a Google Analytics (GA) account set up for your website? Give us—or your IT person—a shout. They are easy to set up and the only technical aspect is placing a small bit of tracking code onto your website. If you have Google Ads or Adwords running now, or in the past, you probably already have the GA code snippet on your website—so get to finding that password! Or do what I do every week for half of my accounts and do a “Forgot My Password” reset...
Once you are in, the next few steps are really easy. You should see a screen that looks something like this:
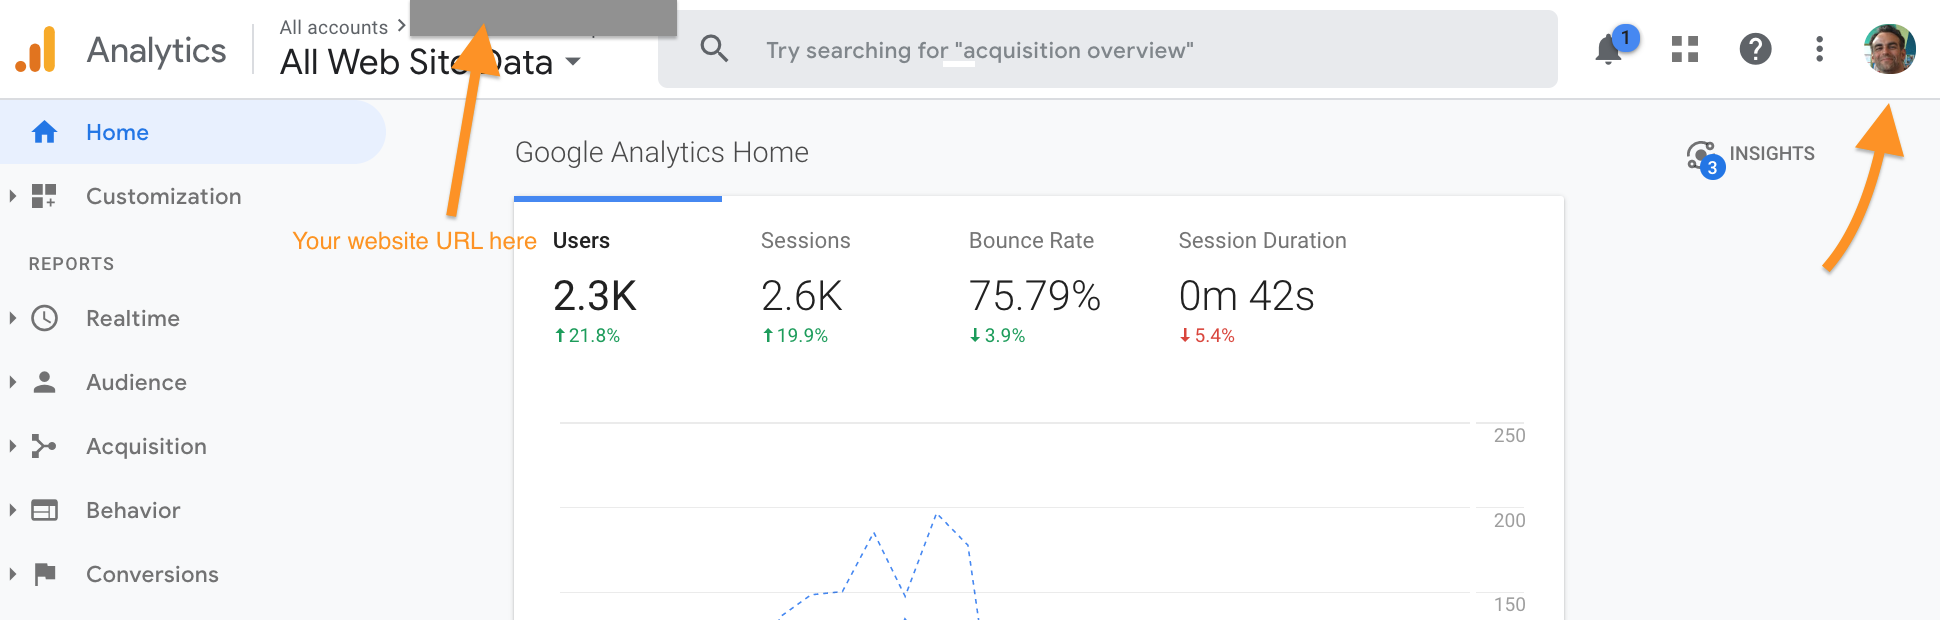
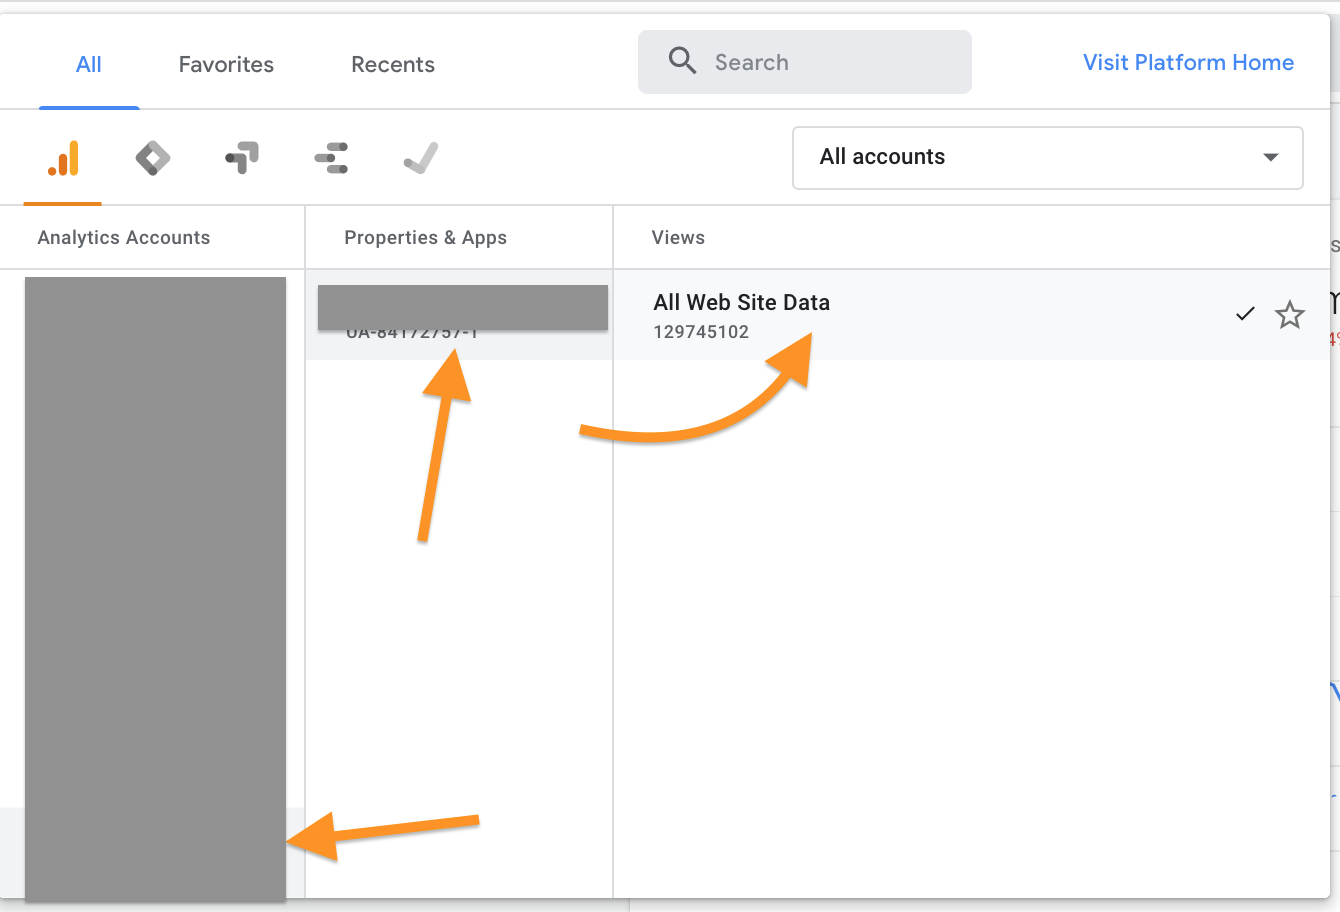
Click on the top, where that top arrow area is pointing, and just make sure the Property and View are the correct ones for your website. In most instances, there will only be one choice and the previous step has defaulted to the Account > Property > View that you want.
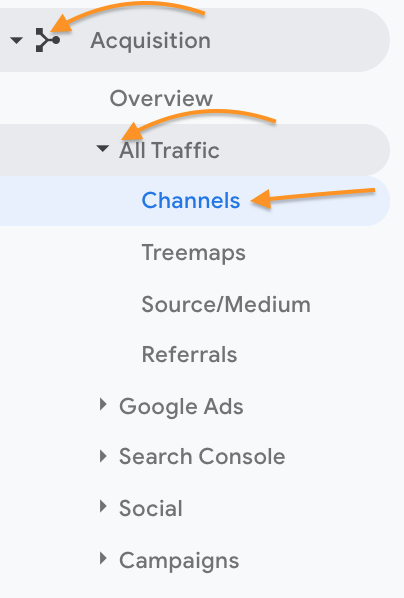
On the left hand side of the screen, click on Acquisition > All Traffic > Channels, like so:
Now... data!
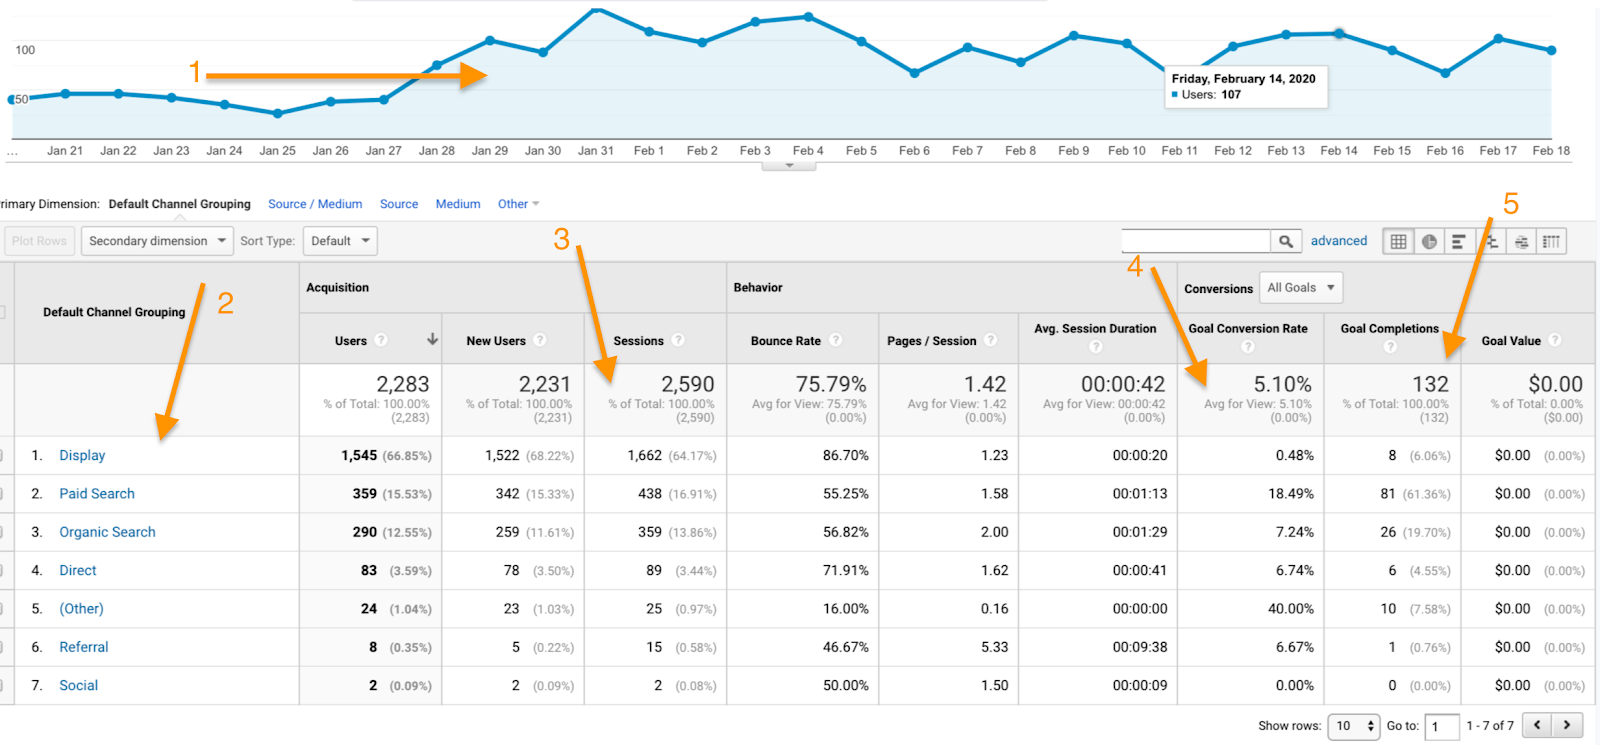
On the top (1), we have a nice visual graph of the number of website sessions over the given time period. This can be changed from website sessions to any metric Google Analytics tracks.
On the left of the table (2), we see that our metrics are ordered by Channel. We then have, amongst other metrics, website* sessions (3), goal completions/conversions (5), and conversion rate (4). Note, for our clients we set up “Goals” in GA that reflect what are most likely new leads for the company. Typically, there is one for website form submissions and one for First-time Callers to the company, as tracked through a third party software we use called CallRail.
With this quick glance at the Google Analytics Channel Report, we are able to quickly see the sessions and web-based leads (goals/conversions) that are coming in from Paid Search Campaigns, Display Campaigns, and Organic (non-paid) traffic. If the company in our example had Email Marketing or Facebook Ads, we would be able to see similar metrics for those marketing channels as well.
Note, the default date range for Google Analytics when you first start it up is the last 30 days. You can quickly change it to the last month, or any given date range, by opening up this box in the top right corner:
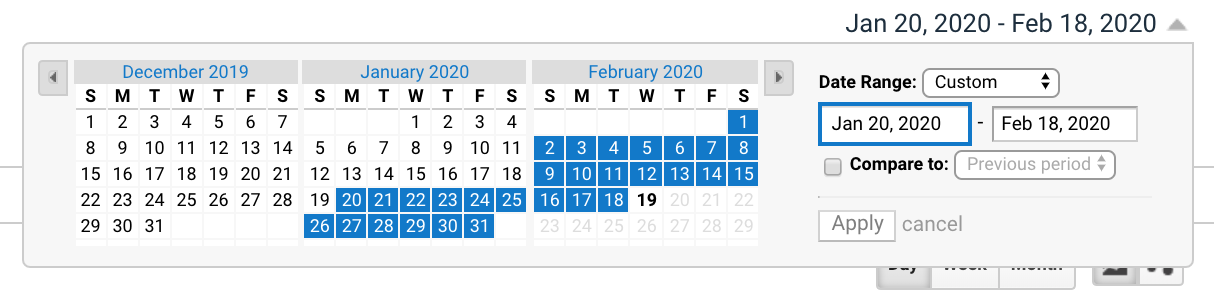
Want to see how you are doing last month vs. the previous? Easy. Just set the date range to the last month and then click on Compare to > Previous Period. Boom(ish). If the previous month had a different number of days, you will just need to manually adjust the date range slightly.
Boom:

Now we can see those same performance metrics for January 2020 versus December 2019!
A note here: As we work with companies that typically have some seasonality to them, based on the weather and other factors, we just as often look at monthly metrics with a Year Over Year (YOY) comparison. This, as well, is easily done in GA. Want to look at your year so far compared to the previous year? That’s easy too: set the date range for January 1st to yesterday and click on Compare to > Previous Year. If you aren’t seeing growth here, please give us a shout.
Ready to dive a little deeper? If you are running Google Ads, click on Acquisition > All Traffic > Google Ads > Campaigns. If you want to look more closely into your non-paid Organic traffic, click on Acquisition > All Traffic > Channels > Organic Search or Acquisition > All Traffic > Channels > Search Console > Queries.
Next month, we will break down Search Console, to see what you can pull out of those reports—and how you can use them to improve your Organic rankings and click-thru-rate (CTR)!